
Smartphone pH Mapping: Seasonal Soil Fixes for Farms
Smartphone pH Mapping: Seasonal Soil Fixes for Farms
This guide explains how to test soil pH across your farm using smartphone-enabled mapping, how to interpret results, and which seasonal fixes to apply to bring each zone to crop-specific targets. Learn step-by-step sampling, safe amendment options, and how to turn maps into prescriptions that fit low-input and regenerative systems.
What is smartphone pH mapping and why use it on your farm?
Smartphone pH mapping is the practice of collecting geo-referenced soil pH readings across a field with a mobile device to produce a spatial map of acidity and alkalinity.
Use it to reveal within-field variability, target lime or sulfur applications, improve nutrient efficiency, reduce input costs, and match crop selection to zone conditions. Extension services such as USDA Natural Resources Conservation Service and land-grant university guides recommend targeted sampling to optimize amendments and avoid blanket treatments.
How does smartphone pH mapping work?
Smartphone pH mapping works by pairing a pH measurement method with a mobile app that records GPS coordinates and timestamps for each sample point.
Common approaches include: using a Bluetooth pH probe that sends values to an app, photographing colorimetric test strips and converting colors to pH with calibration, or manually entering lab results tied to coordinates taken with the phone. Mapping apps create grids or sample layers you can visualize and export as GeoJSON or CSV for prescription planning.
What equipment do you need?
Collect these essentials before mapping: a smartphone with GPS, a reliable pH measurement tool, sample containers, a soil probe or spade, calibration solutions, and a mapping or data-collection app.
- Smartphone with GPS and mapping app (field notebook or GIS-enabled app).
- Portable pH meter or Bluetooth pH electrode for quick point readings; or colorimetric strips for low-cost checks.
- Soil probe or auger to sample to working depth (commonly -6 inches for many crops).
- Clean sample bags or tubes and permanent marker for labeling.
- pH buffer solutions (pH 4, 7 and 10) for calibration and a small container of distilled water for rinsing probes.
How does probe vs lab testing compare?
Probes give immediate, high-density spatial data but require careful calibration and QA/QC; lab tests are more accurate and include buffer pH or lime requirement data.
Combine both: use lab tests for baseline rates and probes for mapping fine-scale variability and monitoring seasonal shifts.
How do you sample soil for accurate pH mapping?
Collect samples with consistent depth, method, and timing: take multiple cores per point, mix for a composite, or sample single points for high-resolution mapping.
Follow these steps to standardize sampling:
- Decide sampling depth by crop: -6 inches for vegetables, -8 inches for many annual crops, deeper for perennial roots.
- Use a grid, zone, or management-unit approach. For coarse testing, composite 10-15 cores per management unit; for mapping, take individual point samples on a regular grid.
- Record metadata: date, crop, recent amendments, moisture condition, and GPS coordinate.
- Avoid sampling immediately after fertilizer or lime application; wait several weeks for reactions to begin or follow extension guidance.
How many samples per acre and what pattern should you use?
Sampling density depends on farm size and variability: use fewer composites for uniform fields and finer grids where soils change rapidly.
Guidelines: for general soil testing use 1 composite per 2-5 acres; for precision smartphone mapping use 1 point every .1-.5 acre (about 400-2,000 m2) or finer if you expect steep micro-variation. Cooperative Extension services often recommend 1 composite per 2.5 acres for standard lime recommendations; increase density when using variable-rate or manual spot treatments.
How do you interpret pH results and set target pH?
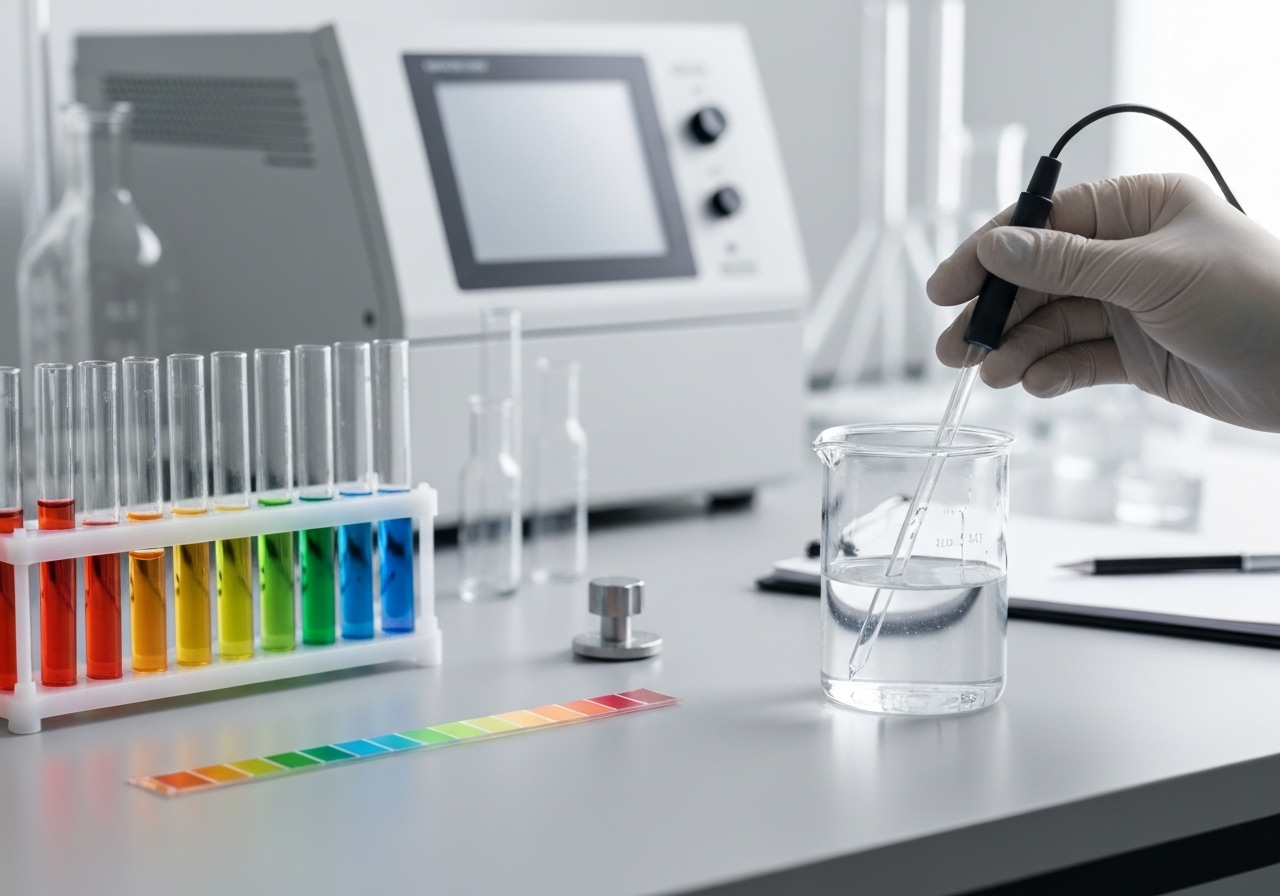
Interpret pH by comparing measured values to crop-specific target ranges; most crops perform best in the 6.-7. range but some have narrow needs.
Use these categories and targets as a starting point:
- Very acidic: <5.5 — many nutrients become less available; consider liming.
- Acidic: 5.5-6.4 — corrective action recommended for many vegetables and grains.
- Near-neutral: 6.5-7.5 — ideal for most field crops and vegetables.
- Alkaline: >7.5 — micronutrients (Fe, Mn, Zn) may become limited; consider acidifying strategies or crop selection.
Set target pH by crop: legumes and many vegetables prefer 6.5-7.; brassicas tolerate slightly higher pH; blueberries and rhododendrons require 4.5-5.5. Reference local crop guides from land-grant extensions for region-specific targets.
What seasonal soil fixes adjust pH and when should they be applied?
Seasonal fixes adjust pH using liming for acidic soils and sulfur or acidifying fertilizers for alkaline soils; timing influences effectiveness.
Key seasonal strategies:
How to raise pH in acidic soils (liming)
Apply agricultural lime to raise pH; pulverized or pelletized lime reacts faster when incorporated and when applied before wetter seasons.
Follow these principles:
- Base lime rate on soil test buffer pH and texture; lab reports from Cooperative Extension include recommended tonnage.
- Apply lime in fall or several months before planting when feasible; rainfall and tillage accelerate neutralization.
- In no-till or perennial systems, surface-applied lime will act slowly; consider mixing into the seedbed where possible.
- Re-test 3-12 months after application to track change and reapply as needed; many farms re-evaluate pH every 2-3 years.
How to lower pH in alkaline soils (acidifying)
Lower pH using elemental sulfur, acidifying fertilizers, or crop selection; elemental sulfur oxidizes to sulfuric acid via soil microbes but requires weeks to months and is temperature-dependent.
Best practices:
- Apply elemental sulfur in small increments and mix into soil when possible; microbial oxidation is slower in cool or dry seasons.
- Use ammonium-based fertilizers (ammonium sulfate) to produce localized acidification where appropriate, keeping fertilizer rates safe for plants.
- Consider selecting acid-tolerant crops or varieties for strongly alkaline zones.
- Consult Extension for rates; acidifying large areas can be slow and costly compared with adjusting crop choice or using foliar nutrient strategies.
What role do organic amendments and biology play?
Organic matter and microbial management buffer pH swings and improve nutrient cycling but do not replace lime or sulfur for large pH shifts.
Use compost, cover crops, and microbial consortia to stabilize pH and improve plant resilience; biological amendments can accelerate sulfur oxidation or help system recovery. For protocols on designing microbial amendments, review strategies for building on-farm microbial consortia.
When should you avoid certain fixes?
Avoid excessive lime on soils already in the neutral range, and avoid strong acidification techniques in poorly drained soils or where subsurface salts are a concern. Gypsum changes sodium balance but does not lower pH and should not be used as a pH fixer.
How do you use smartphone mapping data to make a pH management plan?

Turn maps into a plan by zoning similar pH areas, assigning target pH for each zone, and calculating amendment rates and timing for each zone.
Follow this workflow:
- Import mapped pH points into a GIS or mapping app and create interpolated pH layers (IDW or kriging) to visualize gradients.
- Define management zones where pH and soil type are similar; use crop history and microclimate overlays for decision-making.
- Set targets per zone based on crop and rotation goals.
- Calculate amendment amounts from lab recommendations or lime requirement tables for each zone.
- Apply amendments variably: variable-rate spreaders for larger farms or manual spot treatments for small fields.
Integrate pH plans with rotation strategies to maintain long-term balance; see adaptive planning examples in low-input rotation plans that help schedule pH-sensitive crops into suitable zones and seasons.
How to create prescriptions for small farms
Create a simple prescription sheet: zone ID, current pH, target pH, amendment type, application rate, timing, and notes. Record what you applied with GPS-tagged photos for future validation.
What common pitfalls reduce mapping accuracy and how do you avoid them?
Common pitfalls include inconsistent sampling depth, uncalibrated probes, sampling after recent amendments, and confusing soil moisture effects with true pH differences.
Avoid these errors by:
- Using a consistent sampling protocol and depth across the farm.
- Calibrating pH probes daily and storing buffer solutions properly.
- Avoiding samples right after lime or fertilizer applications unless intentionally tracking change.
- Collecting replicate points and re-sampling anomalous readings before making large decisions.
What monitoring schedule should you follow?
Test and map pH at least annually for high-value or variable fields; test every 2-3 years for pasture and uniform ground.
Recommended schedule:
- Baseline lab test each field or management unit every 2-3 years.
- Smartphone mapping in spring and/or fall when soils are workable and representative.
- Re-test 3-12 months after major lime or sulfur applications to measure effect.
- Map annually when practicing variable-rate amendments or when establishing new microclimate or rotation systems.
How does pH management fit with regenerative practices and soil carbon goals?
pH directly influences microbial activity, organic matter decomposition, and nutrient availability, so managing pH supports regenerative outcomes and soil carbon accumulation.
Use pH maps alongside microbial and carbon measurements to identify zones where biological interventions or cover crops will be most effective. For combining microbial strategies with pH management, consult guidance on designing microbial consortia and integrate with carbon-focused practices referenced in soil carbon programs and local extension resources.
What smartphone tools and apps are recommended for pH mapping?
Choose tools that match your budget and desired resolution: low-cost colorimetric apps for quick checks, mid-range Bluetooth electrodes for fieldwork, and lab services for baselines.
Potential toolset:
- Bluetooth-enabled pH meters with smartphone apps for immediate entry and GPS tagging.
- Color-scanning apps that convert strip color to pH for rapid, low-cost sampling.
- GIS or field-data apps (mobile GIS, CSV export) to create maps and management zones.
- Cloud storage and versioning to keep seasonal maps and application records.
How to calibrate and quality-control sensors
Calibrate pH probes before each sampling session using two-point buffers (pH 4 and 7, or pH 7 and 10) and rinse between samples with distilled water.
Maintain a calibration log, bring spare batteries, and periodically validate probe readings against lab tests to quantify systematic bias and correct mapping layers.
How do you calculate amendment quantities from mapped zones?
Calculate quantities by combining zone area with lab-based amendment rates; convert tons-per-acre or kg-per-hectare to your application units and adjust for material neutralizing value.
Steps:
- Determine zone area from your map (acres or hectares).
- Use your soil lab’s lime requirement or buffer pH-based rate for the current and target pH.
- Adjust rate by calcium carbonate equivalent (CCE) of your lime source; lower CCE means more material needed.
- Plan application in the season that maximizes reaction (fall for lime in many regions) and record each application with GPS tags.
Which crops and rotations reduce pH management burden?
Choose crops that match existing zone pH where feasible and use rotations that avoid repeatedly stressing soil pH in the same area.
Implement cover crops and legumes to build organic matter and buffer pH swings; coordinate pH-sensitive plantings with your rotation plan and local microclimate maps for best fit. See how rotations can be designed to work with variable zones in adaptive rotation plans.
How should you document and evaluate outcomes?
Document every sampling event, amendment application, and crop response with time-stamped GPS records, photos, and short notes; compare seasonal pH maps to evaluate treatment effectiveness.
Evaluate outcomes by re-mapping after 3-12 months to measure pH shifts, tracking yield or plant health per zone, and adjusting future prescriptions based on empirical results.
What are next steps for farms ready to scale pH mapping?
Scale by standardizing protocols, investing in higher-accuracy sensors or lab partnerships, and integrating pH maps into broader sensor networks (moisture, EC, microbial data) for data-driven management.
Consider linking pH mapping with sensor networks and AI tools to predict high-risk zones and schedule fixes proactively. For examples of sensor-enabled systems that add value to maps, review innovations in sensor-guided soil monitoring and microclimate mapping resources.
If you are starting in a small or diversified operation, begin with a single-season mapping project: collect baseline lab tests, run a high-density smartphone probe survey, apply recommended amendments to a test zone, and monitor results. Use those lessons to expand mapping to the whole farm in subsequent seasons.


