
Sensor-Managed Mixed-Height Windbreaks for Crop Resilience
Sensor-managed mixed-height windbreaks combine layered plantings and real-time monitoring to protect crops, reduce water loss, and improve microclimates. This guide explains purpose, design, sensor choices, species layout, planting and maintenance steps, expected benefits, costs, and how to integrate windbreaks into rotation and farm planning.
What is a sensor-managed mixed-height windbreak for crops?
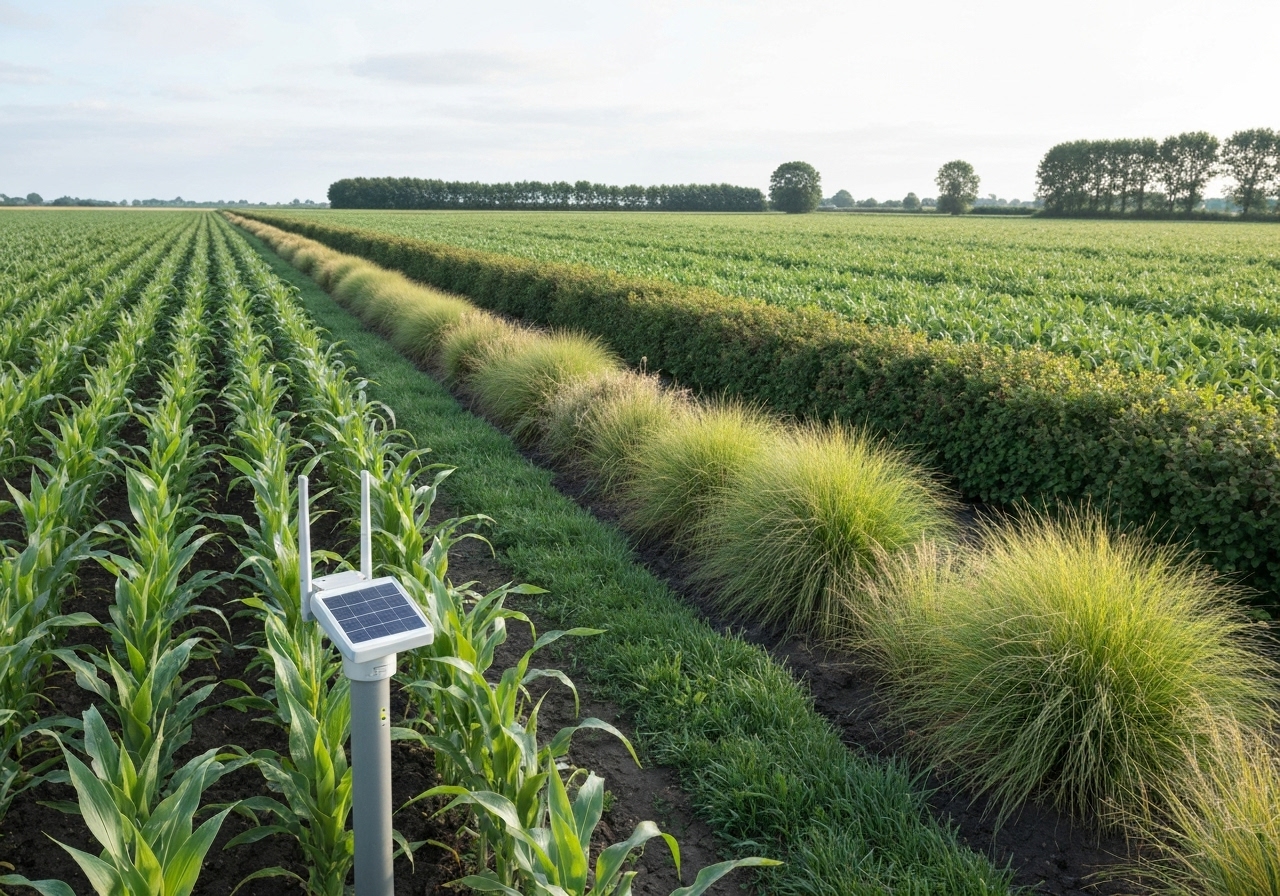
What is a sensor-managed mixed-height windbreak: a deliberately layered shelterbelt managed with sensors to optimize wind reduction, microclimate buffering, and ecological services for adjacent crops. What is a sensor-managed system contrasts with static windbreaks by using weather, soil, and plant sensors to guide pruning, irrigation, and reinforcement plantings. What is essential to include are mixed-height rows – tall trees, medium shrubs, and low perennial grasses – combined with distributed sensors for an active management loop. What is important for designers is to treat the windbreak as an adaptive infrastructure that responds to seasonal and multi-year changes using data-driven thresholds (USDA NRCS guidance 2018; FAO agroforestry manuals).
Why use mixed-height windbreaks for crop protection?
Why use mixed-height windbreaks: they reduce wind speed, cut soil erosion, lower crop evapotranspiration, reduce lodging, and provide habitat that increases biodiversity and pollination services. Why use this approach produces layered shelter that intercepts different wind profiles, reducing gusts and turbulence more effectively than single-row plantings. Why use is backed by conservation studies showing windbreaks increase yields near leeward edges by measurable margins and reduce topsoil loss (FAO 2013; Agroforestry Systems research 2015). Why use mixed heights increases year-round protection when evergreen shrubs are included, and enhances multi-functionality by combining timber, forage, and habitat values.
How do sensors improve windbreak performance?
How sensors improve performance: sensors provide real-time wind, temperature, humidity, soil moisture, and plant-stress data so managers can act on thresholds for irrigation, pruning, and gap plantings. How sensors work includes anemometers to measure wind speed and direction, sonic or cup types for gust detection, temperature and relative humidity probes for microclimate mapping, soil moisture probes at multiple depths, leaf wetness sensors for disease risk, and camera or multispectral drone imagery for canopy health. How sensors feed into decision systems that automate or advise actions – for example, triggering targeted irrigation when moisture falls below a crop-specific threshold or scheduling selective thinning to restore optimal porosity. How sensors have reduced water use and improved survival in trials of sensor-guided agroforestry and polyculture systems (IoT in Agriculture review 2019; Smart Agriculture field trials 202).
What species and layout work for mixed-height windbreaks?
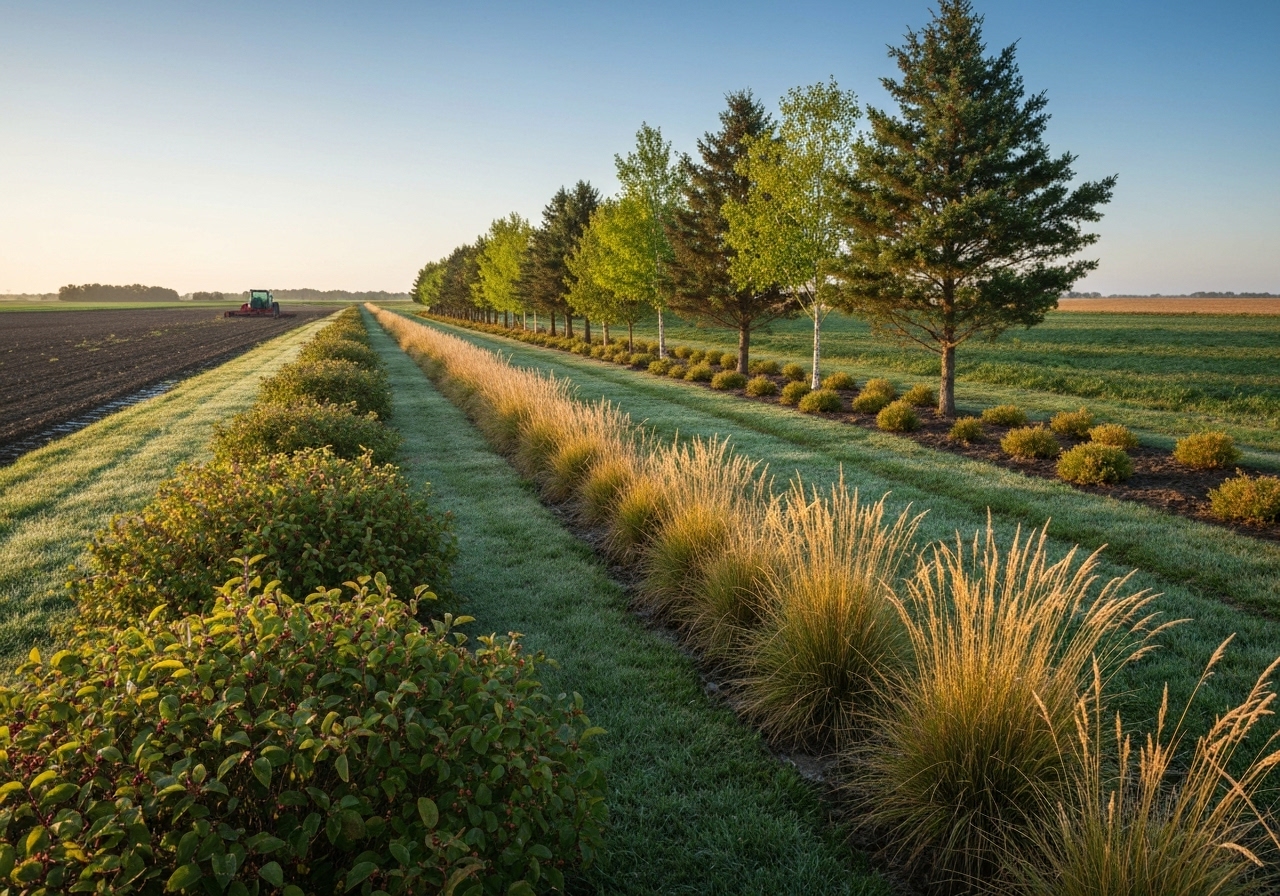
What species and layout work: select regionally adapted species arranged in layers – tall trees in outer rows, medium shrubs in middle rows, and dense low shrubs or grasses in inner rows – to achieve 40-60% porosity and diverse functionality. What species selection prioritizes native or non-invasive trees for long-term resilience, including fast-growing pioneer trees for early protection and slower-growing natives for permanent structure. What layout typically uses 2-5 rows: row 1 (windward) with tall fast-growing trees for initial drag; row 2-3 with medium-height trees and shrubs to break turbulence; row 4 with dense low shrubs and grasses to reduce near-surface wind. What spacing guidance aims for 40-60% porosity to lower wind speed without creating excessive turbulence; porosity is controlled by plant spacing, crown overlap, and pruning. What placement rules place the windbreak perpendicular to prevailing winds and at a distance less than 10 times the mature height from the crop edge to ensure protection across the target zone (USDA NRCS 2018).
Examples of functional traits and species choices
What traits to choose: deep roots, wind-firm stems, year-round density, and flowering for pollinators. What temperate options may include native conifers or broadleaved evergreens for year-round screening and fast-growing deciduous pioneers for early height. What subtropical and Mediterranean contexts benefit from drought-tolerant shrubs and nitrogen-fixing species to improve soil fertility. What urban or small-plot options prioritize compact species and multiuse hedgerows. What matters most is choosing species suited to soil, water, and pest context; local extension services often have lists of recommended natives (FAO agroforestry guides).
How to design sensor-managed layout and placement?
How to design: perform a site assessment, map prevailing winds and microclimates, select sensor network density, and set management rules aligned to crop vulnerability and farm goals. How to begin includes mapping wind roses and microclimate zones using short-term field sensors or historical weather data. How to decide sensor density uses one anemometer per 1-5 hectares for field-scale wind mapping, added soil moisture sensors at representative points every 50-200 meters along the break, and temperature/humidity sensors at canopy and crop height to capture vertical gradients. How to integrate data uses a central gateway or cloud platform to stream sensor data into dashboards where thresholds trigger alerts or automated actions. How to define management rules sets numeric triggers – for example, reduce porosity when measured gusts exceed threshold X, or irrigate tree rows when soil moisture at 20-cm depth drops below Y% of field capacity.
Design checklist

- How to assess site: wind rose, topography, soil type, salinity, and groundwater depth.
- How to map: place sensor transects perpendicular to wind direction across intended windbreak alignment.
- How to size: aim for a mature height that protects the crop zone 2-10 times the tree height downwind depending on crop sensitivity.
- How to set porosity: design for 40-60% overall porosity across the multi-row section.
How to implement phased planting and management?
How to implement phased planting: install in staggered stages so early rows provide protection while later rows establish, and use sensors to time supplemental irrigation and reinforcement plantings. How to stage plantings generally starts with quick-establishing outer rows in year to 2, then fills inner rows with slower-growing but denser species in years 2 to 5. How to prepare soil includes deep ripping if compacted, adding compost to build organic matter, and installing root barriers where necessary to prevent crop competition. How to protect seedlings uses temporary tree guards and mulches, and how to prioritize watering uses moisture sensors to allocate scarce irrigation to the most stressed zones. How to thin and prune uses sensor-driven schedules: maintain porosity targets by removing selected stems when canopy density exceeds the design threshold.
How to maintain and monitor windbreaks using sensors?
How to maintain: perform seasonal checks informed by sensor alerts, conduct pruning to manage porosity, replace failed plants detected by imagery or ground sensors, and monitor pests and disease with leaf wetness and thermal alerts. How to set maintenance frequency typically follows quarterly inspections plus event-driven checks after storms. How to use remote sensing includes drone NDVI or RGB surveys twice annually to spot gaps and stress before they become large problems. How to act on sensor data includes replacing dead plants in the next planting window, installing targeted irrigation where soil probes report chronic deficits, and applying integrated pest management if leaf-wetness and temperature patterns indicate disease risk (Smart Agriculture literature 202).
What agroecological and economic benefits should you expect?
What to expect: measurable reductions in wind speed, lower crop water demand, reduced erosion, improved yields near protected edges, enhanced pollinator habitat, and long-term carbon sequestration. What studies report includes yield increases of 5-25% at protected edges depending on crop and region, irrigation savings of 10-30% in wind-exposed fields, and significant reductions in soil loss (FAO 2013; USDA NRCS assessments). What economic benefits include diversified income streams if windbreak species produce fruit, timber, forage, or biomass, and potential additional revenue from carbon credits or ecosystem service payments (soil carbon programs and carbon-smart crop initiatives). What to account for is that benefits accumulate: protection and microclimate improvements grow as trees mature, so payback horizons are commonly 5-15 years with long-term value beyond that.
How to integrate windbreaks into crop rotations and farm planning?
How to integrate: place windbreaks within rotation maps and adaptive rotation plans so they complement crop sequences, reduce edge-related losses, and serve as living infrastructure for polycultures and agroforestry mosaics. How to include windbreaks operationally uses rotation planning to map shaded zones, modify row crops adjacent to the shelterbelt, and integrate orchard or perennial strips where appropriate. How to coordinate with rotations links windbreak placement to cover crop timing and residue management to reduce competition and boost soil cover. How to apply adaptive rotation methods from crop planning resources enhances resilience by aligning shorter-season crops near edges and longer-term perennials where protection is strongest. How to read more about rotation planning and adaptive low-input systems consults practical guidance such as the adaptive rotation plans for small farms which provide frameworks for integrating permanent features like windbreaks into seasonal cycles. Explore rotation strategies adapted for integrated windbreaks.
What are common problems and how do you solve them?
What problems arise: competition for water, shading of adjacent crops, pest reservoirs, and initial establishment failures; solve with species choice, root management, irrigation prioritization, and sensor-based early warnings. What mitigations work include installing root barriers or buffer strips to limit root competition, pruning to control shade cast on sensitive crops, and selecting low-host species for major crop pests. What operational fixes include targeted irrigation to tree rows during establishment to avoid crop stress, and deploying leaf-wetness sensors and pheromone traps to manage pest outbreaks early. What long-term prevention includes regular rotation of understory plants and maintaining plant health to reduce disease reservoirs.
How much do sensor-managed windbreaks cost and what funding exists?
How much they cost: establishment costs vary widely – expect $5 to $30 per linear meter for plants and site prep and $200 to $10,000+ for a basic sensor network depending on coverage and connectivity; maintenance and replacement add recurring costs. How to budget includes seedling and labor costs, irrigation infrastructure, sensors and gateways, and data platform subscriptions. How to reduce upfront costs explores phased planting, use of volunteer labor, and low-cost sensor platforms. How to fund projects looks to public conservation programs, agroforestry cost-share grants, and emerging carbon-credit mechanisms for on-farm trees; programs vary by country and region. How to evaluate return on investment compares reduced crop losses, lower irrigation costs, and potential revenue from windbreak products and carbon credits (soil carbon credit pilots and farm-level carbon programs).
How to scale and adapt sensor-managed windbreaks for small and urban farms?
How to scale for small and urban farms: use compact, multiuse hedgerows, container trees, and modular sensor kits to create protective belts scalable to rooftops, microplots, and community gardens. How to adapt species selection favors dwarf or columnar forms, wind-tolerant shrubs, and perennial herbs for small spaces. How to deploy sensors uses low-cost soil moisture sensors, micro-anemometers, and simple temperature/humidity loggers with LoRa or Wi-Fi gateways to a central dashboard. How to combine windbreak design with microclimate zoning practices uses fine-scale mapping to place seasonal crops in favorable thermal niches; consult microclimate mapping practices to tune windbreak orientation and density for urban plots. See microclimate mapping methods for small-scale placement.
How do windbreaks fit into sensor-guided polyculture and regenerative systems?
How they fit: windbreaks act as structural elements in sensor-guided polycultures by buffering crops and supporting companion species that improve soil, pollination, and pest regulation. How to integrate includes positioning windbreaks to create microclimate corridors that allow staged polyculture planting and to host beneficial insects. How to coordinate with sensor-guided polyculture systems uses the same sensor networks to manage both crop and windbreak health, optimizing water and nutrient flows. How to learn practical design examples aligns with resources on sensor-guided polyculture to replicate effective field-level systems on family farms. Read about sensor-guided polyculture designs useful for windbreak integration.
Where can you find further technical support and resources?
Where to find support: consult local extension services, national conservation agencies, agroforestry research centers, and guides on funding and carbon programs to plan and finance windbreak projects. Where to look includes USDA NRCS windbreak guides, FAO agroforestry manuals, regional agroecology teams, and peer-reviewed literature on shelterbelt performance. Where to consider funding and revenue streams includes exploring soil carbon credit programs that recognize tree and soil carbon accumulation on farms. Investigate soil carbon credit options that can support windbreak investments.
Which monitoring metrics should you track?
Which metrics to track: wind speed and direction, gust frequency, soil moisture at multiple depths, canopy density, crop microclimate at canopy height, plant stress indices, and gap size in the windbreak. Which thresholds to set depend on crop risk profiles – e.g., trigger reinforcement planting if dead-plant gaps exceed 5% of total length, or schedule pruning when porosity deviates from 40-60% target. Which analytic outputs to use include time-series charts, heat maps of moisture or temperature, and alerts for rapid changes such as storm damage or disease onset.
What are quick-start steps for a first pilot?
What to do first: perform a one-season wind and microclimate survey, install a minimal sensor transect, plant a pilot 2-3 row mixed-height strip, and use data through the first two years to refine layout and species choices. What tasks to prioritize include mapping prevailing wind direction, selecting native species for the first trial strip, and building simple dashboards to visualize wind and moisture. What to measure over year 1-3 includes seedling survival, microclimate shifts at crop height, and impacts on adjacent crop performance. What to refine uses iterative adjustments to porosity and planting density based on measured outcomes.
Implement sensor-managed mixed-height windbreaks as living infrastructure: combine ecological design principles, regional species selection, phased establishment, and a sensor-informed management loop to protect crops, conserve water, sequester carbon, and diversify farm outputs. Use local support networks and adaptive planning to tune designs to your site and goals.


